

The analysis made in the report is a preliminary analysis done based on data available on the date of creation of the report, April 2, 2020. A follow-up analysis will be done separately with updated stats and presented in the upcoming report.
Problem Statement
The main objective of this activity is to implement an epidemiological model that can be used to model the COVID-19 outbreak and subsequently be used to forecast the impact of the outbreak. For the sake of this activity, we restrict the study area to 5 countries in the European Union, namely, Italy, Spain, Germany, France, and Switzerland; and the United Kingdom. These countries have been selected due to the high case fatality rate with respect to their population.
Objectives
1. Put forward key points of analysis on the global situation of the COVID-19 pandemic
2. Implement an epidemiological model as an extension of an existing model
3. Forecast the growth of the outbreak for the next 3 months
4. Analyze how the growth of the outbreak will affect the population, i.e, in terms of the number of positive cases and fatalities
5. Analyze how effective preventive measures are in containing the outbreak
6. Estimate the number of days it will take to contain the outbreak
Basic Insights
In this section, we analyze the data that we have on the number of confirmed, recovered, and fatal cases of COVID-19. We first justify the trends we observe just by the quantity of the cases and then go on to analyze what this tells about the stage of the disease in the respective country and go on to see when the respective governments have imposed preventive measures and how effective they have proven to be.
Analysis by Cases
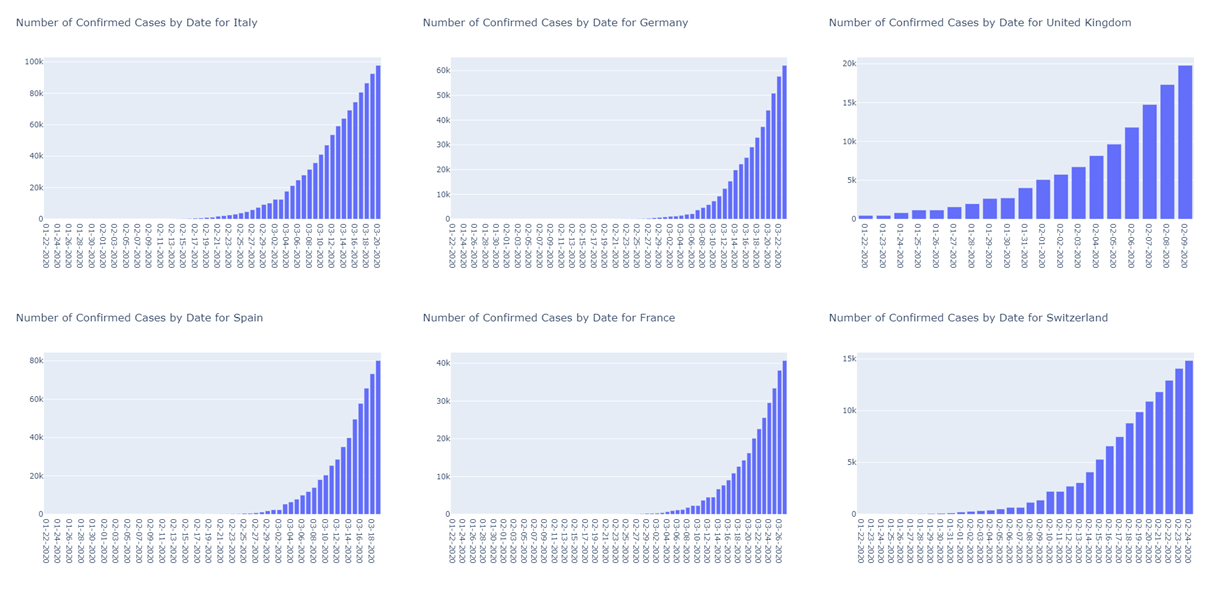
In all the six countries of interest, the number of confirmed cases and deaths has been on the increase since the first case was detected. For Italy, Spain, Germany, France, and Switzerland, there is a steady increase in the number of recoveries owing possibly to the medical care and also possibly the preventive measure like quarantines and lockdowns which bring down the possibility of infection and reinfection. (Refer to Figures 1–3)
Analysis by Stage
Any pandemic or disease outbreak has a set of stages it follows:
Stage 1: Small number of cases, with no local transmission, just imported cases.
Stage 2: Sustained local transmission of disease.
Stage 3: Widespread outbreak, government intervention to regulate.
Stage 4: Burst in the number of cases to the level health care systems can’t handle.
Stage 5: Drop in the number of cases and recovery.
From Figure 1, we see that all the countries of interest are in Stage-3 or 4. If we are able to find a reliable dataset of the number of hospital beds, patient-to-healthcare worker information we can pinpoint if a given country has reached Stage-4.
Figure 1: Epidemiological curves- Confirmed Cases


Methodology
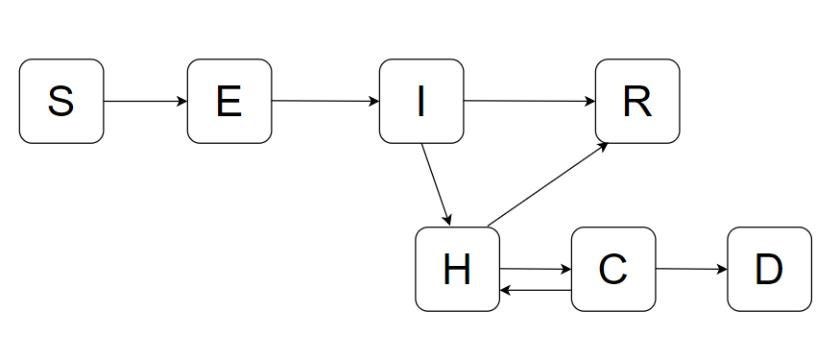
SEIR Model with additions
In the SEIR model, S denotes the number of individuals who are susceptible to contracting the disease; E denotes the number of individuals who are exposed to the disease but not yet contagious, I denotes the number of individuals who are infected and contagious, R denotes the number of individuals who have recovered or removed (Death). We are trying to experiment with a variation of this model by adding some other factors. As shown in Figure 4 as opposed to the SEIR model where the end state is assumed to be recovery or death, we also add an alternate path where the result could be death in addition to recovery, but also intermediate states where individuals may be hospitalized then reach a critical state after getting infected. Hence the added states in the new model are H, which denotes the number of hospitalized individuals, C denotes the number of people who reach a critical stage after being hospitalized and D is the number of individuals who succumb to the disease and die.
Given below are the rates of change of each of the variables,

Assumptions
1. S + I + E + R + H + C + D = N, where N is the total population of the region of interest.
2. N is constant throughout the analysis. (This assumption has been made since daily birth and deaths for every country is a difficult dataset to obtain)
3. The people who are hospitalized and in the critical stages are not infectious.
4. Recovered individuals are removed i.e, are now immune to the disease. (Studies on this are still going on)
Implementation
Initial Model Parameters

We forecast the confirmed cases and deaths using the above model and model parameters for two cases:
1. Constant Reproduction Rate
Constant reproduction rate means that from the start of the disease no measure has been taken to stop the spread. It is letting the disease takes its course.
2. Decaying Reproduction Rate
For the decaying reproduction rate, we have chosen Hill decay. It is mostly chosen through a literature review which suggests that Hill and Logistic decay functions perform well in the early, middle, and late stages of an epidemic. Decaying reproduction rate is meant to represent the active measures taken to stop the spread of the disease, i.e, through quarantine of infected individuals, distancing susceptible individuals, meticulous health care, etc.
Analysis of Results and Conclusion
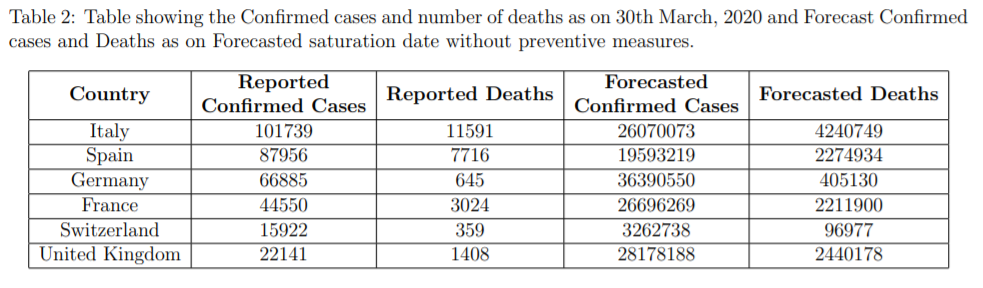
Table 1, lists the dates of important events in the timeline of the COVID-19 outbreak in the respective countries along with forecasted dates of saturation with and without preventive measures. It is seen that in Italy even if the positive cases count is high the saturation has started by the end of March if the preventive measures are effective and medical care facilities are optimum, for decaying Rt cases. Germany and the United Kingdom seem to have imposed restrictions only very late so even with decaying Rt, it might take a longer duration to stop the spread of the disease, and consequently, more people will be affected as shown in Table 2, If the reproduction rate significantly decays, Switzerland might already be in Stage 5 as this report is being written.


Drawbacks and Future Scope
- We have not accounted for the births and deaths daily, i.e, we have kept the population of the country to be constant throughout the analysis which is not the ideal case.
- We have assumed that recovered individuals are immune to the disease which might not be the case,i.e, there might be recurrent cases.
- The initial model parameters are an assumption based on observations worldwide but each country might have it’s out a different set of parameters.
- We have not accounted for the age factor and preexisting conditions of the populations and how some people are more susceptible to contracting the disease. If the dataset for this is available this can be done. Published data, shows that people above the age of 65 and with existing pulmonary or cardiac conditions or smokers are at more risk.
- It would be interesting to study how much more at risk of contracting the disease, the health care workers are.
- If we are able to find reliable data on hospital beds and doctor-to-patient ratio for each country, we can access it when the health sector will be stretch to its limits
- Finding a correlation between the reproduction rate and the measures imposed by the government will give us an idea as to which one is more effective.
- Find a way to weed out false positives in the confirmed cases
References
- https://neherlab.org/covid19/
- https://www.forbes.com/sites/brucelee/2020/03/18/what-percentage-have-covid-19-coronavirusbut-do-not-know-it/12857
- https://www.mckinsey.com/business-functions/risk/our-insights/covid-19-implicationsfor-business
- Ying Liu, Albert A Gayle, Annelies Wilder-Smith, Joacim Rockl¨ov, The reproductive number of COVID-19 is higher compared to SARS coronavirus, Journal of Travel Medicine, Volume 27, Issue 2, March 2020, taaa021, https://doi.org/10.1093/jtm/taaa021
- The University of Massachusetts Amherst. ”Median incubation period for COVID-19.” ScienceDaily. ScienceDaily, 17 March 2020.
Datasets and Sources
- https://www.ecdc.europa.eu/en/publications-data/download-todays-data-geographic-distributioncovid-19-cases-worldwide
- https://data.worldbank.org/indicator/SP.POP.TOTL
- https://www.who.int/emergencies/diseases/novel-coronavirus-2019/situation-reports


Written by Sanjutha Indrajit, Junior Geospatial Data Scientist, SatSure. This story was first published on our Medium.


Add comment